Region · Market Report
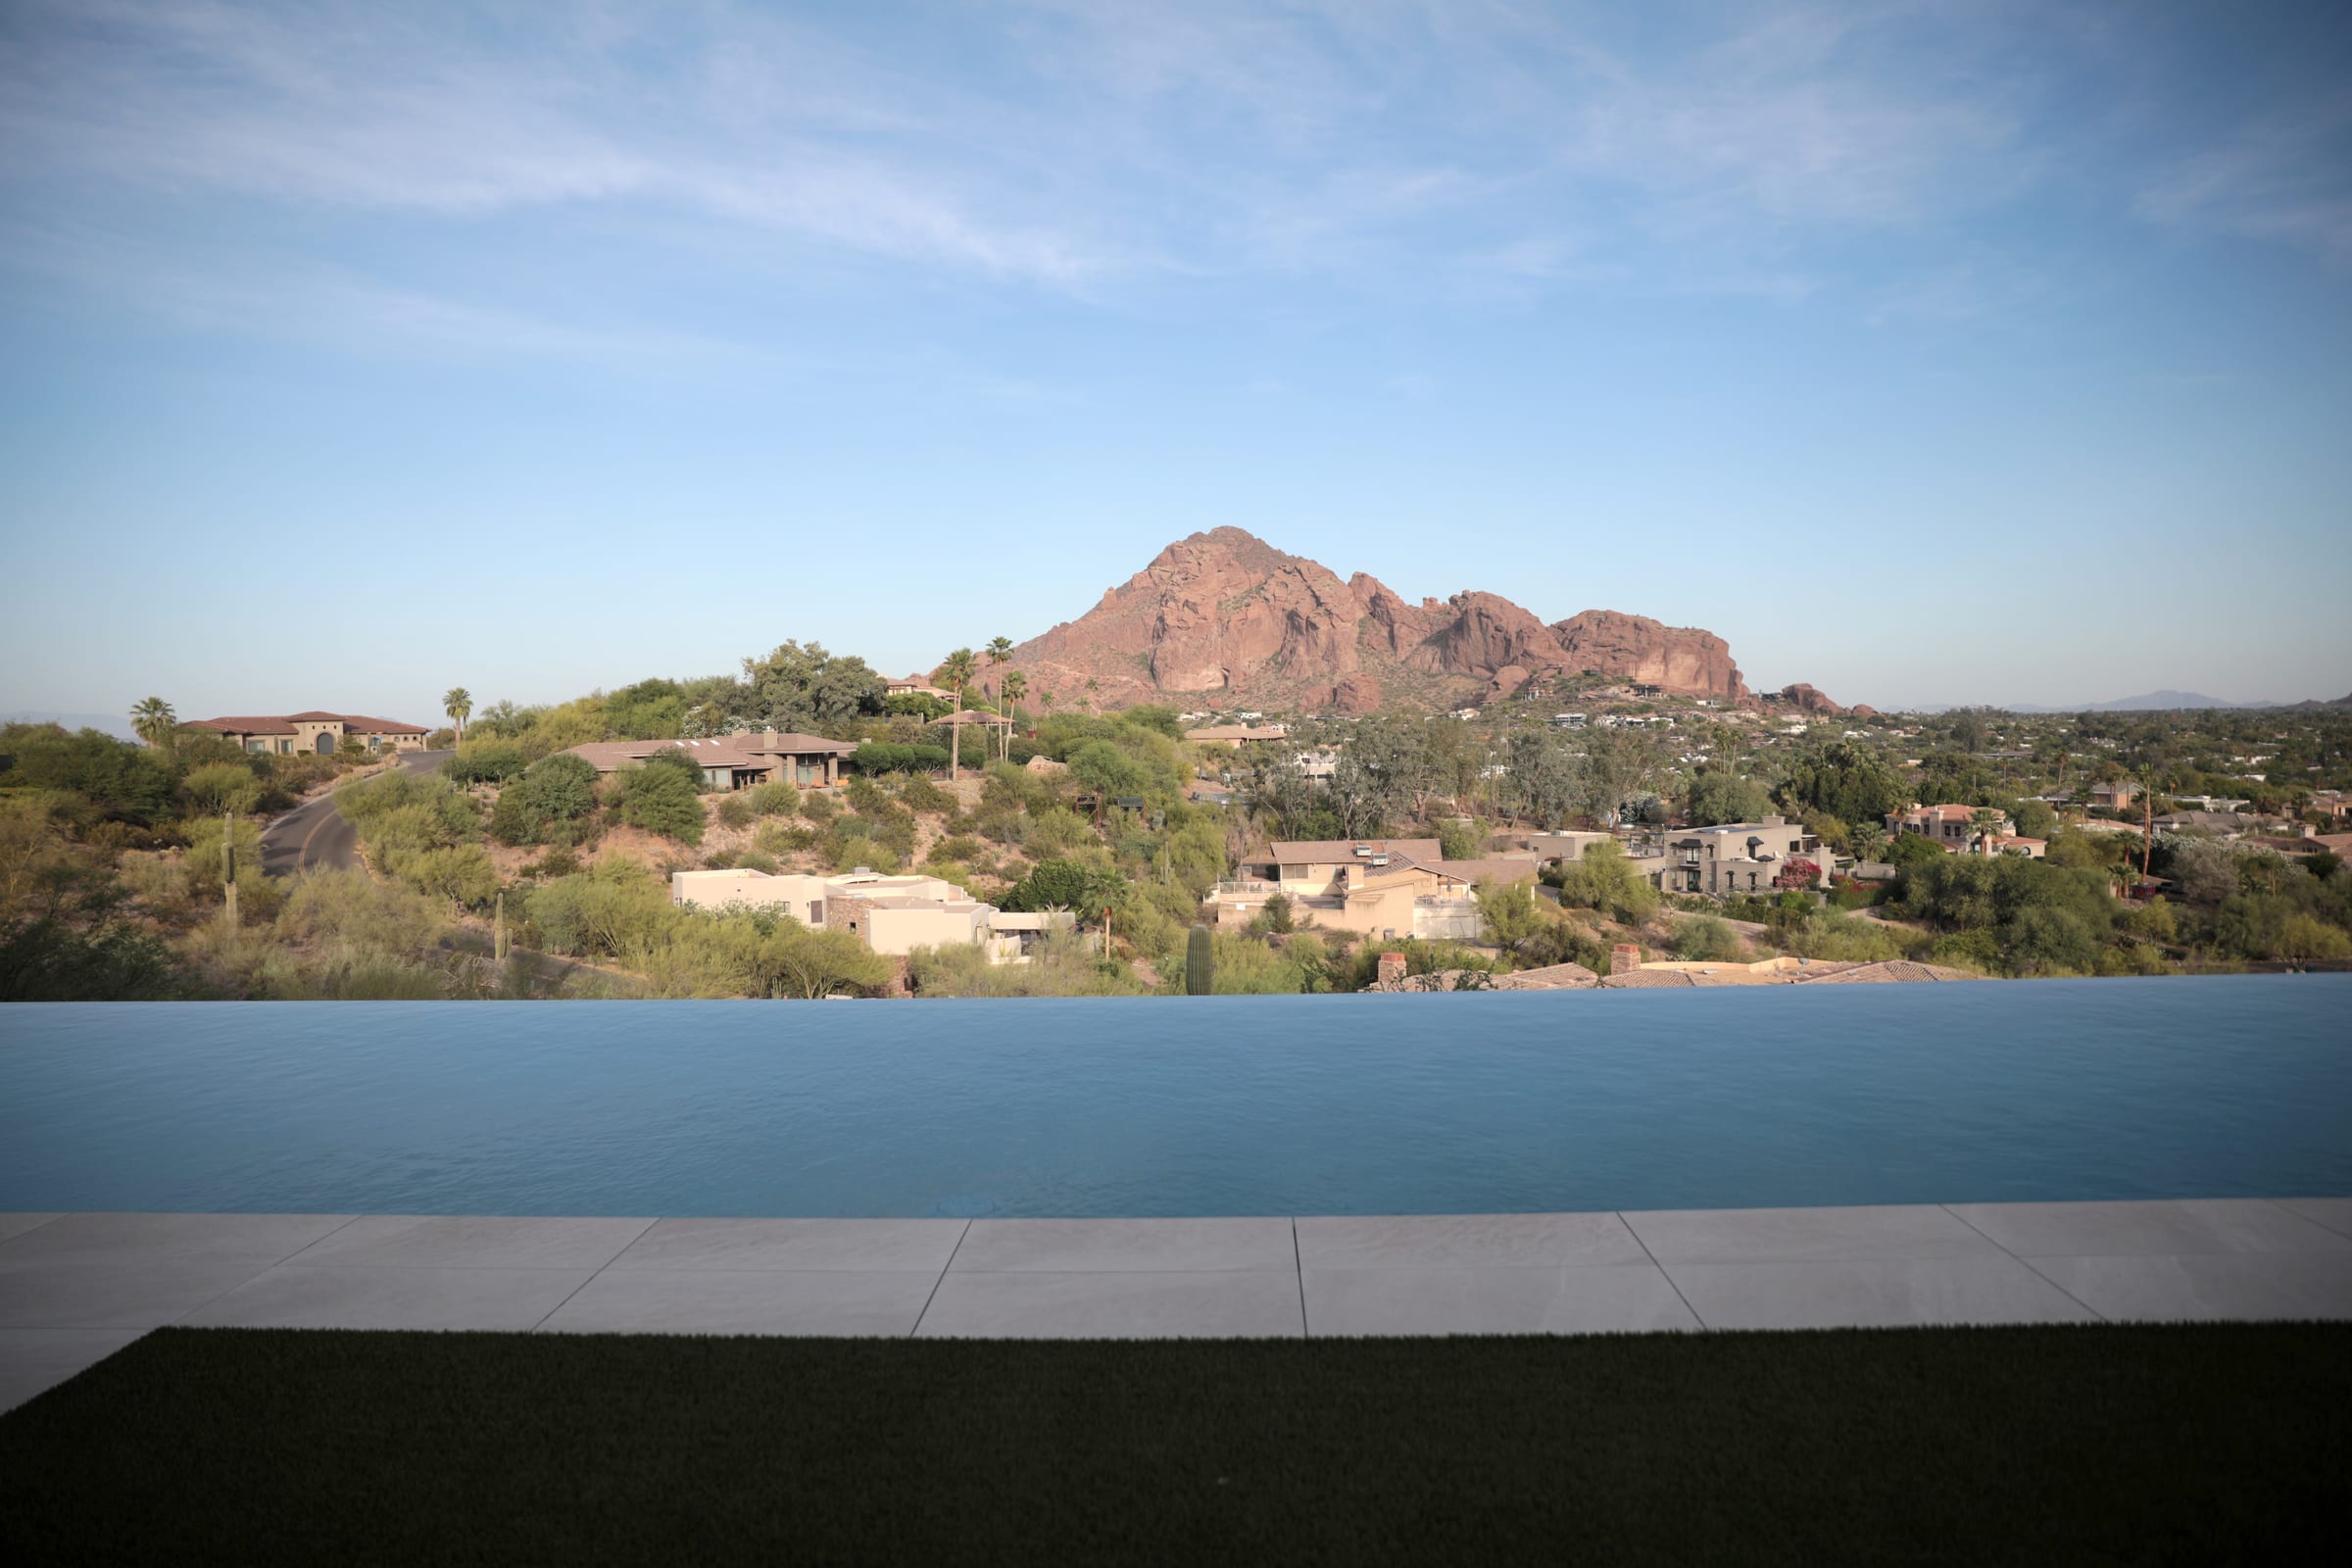
Paradise Valley
This region report tracks how the Paradise Valley luxury market has moved over the trailing twelve months — median sale price, price per square foot, days on market, months of supply, and the gap between list and closing price. Read it as a snapshot of negotiating leverage: where inventory, pricing, and pace favor buyers, and where they favor sellers.
Yong Choi pairs these figures with on-the-ground context — recent comparable closings, quiet off-market activity, and the demand patterns specific to Paradise Valley — to price a listing or structure an offer with precision. The numbers below refresh from public records and proprietary marts; the judgment behind them comes from representing buyers and sellers across this market firsthand.
At a glance
The market, in eight numbers.
—
Median Sale
—
Active Listings
—
Median Days on Market
—
Median PPSF
—
Closings (T12M)
—
Pending
—
Months of Supply
—
YoY $/SqFt
How we read the market
Three inputs.
Recorded market transactions, public deed filings, and Yong’s private RLSIR network registry. The data flows from public records and proprietary sources through the dbt analytics pipeline; per-scope marts are rebuilt every four hours.